Discover the power of Candlesticks in technical analysis. Learn about the history and origin of Candlesticks and how they are used to interpret market trends and make informed trading decisions.
Introduction
Candlesticks are a type of financial chart used to represent the price movement of an asset, such as stocks, currencies, or commodities, over a specific period. Originating in Japan during the 18th century, candlesticks have been widely adopted by traders and investors to analyse market trends and make informed investment decisions. A single candlestick typically shows the opening and closing prices, as well as the high and low prices, of an asset over a given time frame, such as a day, week, or month. By using candlesticks, traders can identify patterns and predict future price movements, making them valuable tools for short-term and long-term trading strategies.
History and origin of Candlesticks
The history and origin of candlesticks date back to the 18th century in Japan, where Japanese rice traders originally used them to track price movements and make informed trading decisions. The term “candlestick” refers to the visual representation of the price data, which resembles a candle with a wick, body, and two shadows (or “candle sticks”).
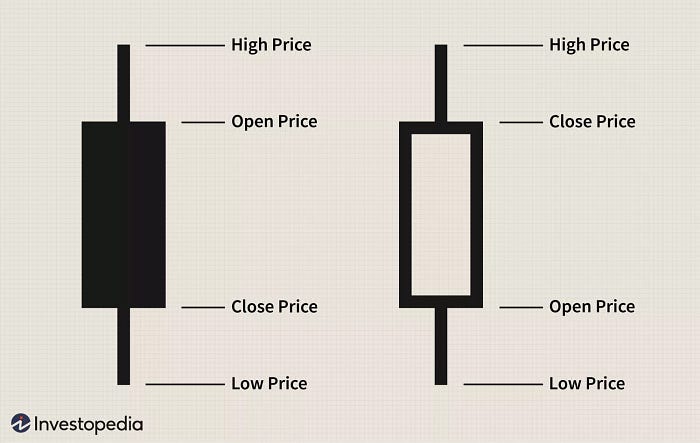
The candlestick’s body represents the difference between an asset’s opening and closing prices over a specified time. If the closing price is higher than the opening price, the body is usually depicted in green or white and is referred to as a “bullish” candlestick. If the opening price is higher than the closing price, the body is usually depicted in red or black and is referred to as a “bearish” candlestick.
The wick, also known as the “shadow” or “tail,” represents an asset’s high and low prices over the same period. The upper shadow represents the high price, while the lower shadow represents the low price.

Source: investopedia
Candlestick charts became popular in the West in the late 20th century and have since become a staple of technical analysis for traders and investors worldwide. Today, candlesticks are widely used to analyse market trends, identify price patterns, and make informed trading decisions in various financial markets, including stocks, currencies, commodities, and more.
How candlesticks are used to interpret market trends and make informed trading decisions with chart
Traders and investors commonly use candlesticks to interpret market trends and make informed trading decisions. A candlestick chart is a financial chart used to represent price data over a specified period, usually daily or weekly. Each candlestick in the chart represents a single day’s price data, and the candlesticks visually represent the market trend over time.
Traders use candlestick charts to identify price patterns, such as bullish and bearish reversal patterns, and to make informed trading decisions based on these patterns. A bullish reversal pattern, for example, is formed when a large bullish candlestick follows a series of bearish candlesticks. This can signal a trend reversal from bearish to bullish, and traders may buy the asset.
Candlestick charts can also be used with other technical analysis tools, such as moving averages, support and resistance levels, and volume analysis, to provide a more comprehensive picture of the market trend.
Here is an example of a simple candlestick chart:
Source: Investopedia
In this chart, each candlestick represents the price data for one day. The green candlesticks indicate days where the closing price was higher than the opening price, while the red candlesticks indicate days where the closing price was lower than the opening price. The candlestick’s body represents the difference between the opening and closing prices, while the wick or shadow represents the high and low prices of the day.
By analysing the price patterns represented in the candlestick chart, traders can gain insights into the market trend and make informed trading decisions based on these insights.
Conclusion
Traders and investors use candlesticks are useful tools to analyse market patterns and make well-informed trading choices. Candlestick charts provide price data over time as a visual representation, making it easier for traders to see price patterns and base their trading decisions on them. Candlesticks have a long history that stretches back to Japan in the 17th century when they were first utilised as a popular and common instrument in the financial industry.
An exciting read, right? Follow our blog for future updates.
>>>
For more information, stay connected on our social media pages and ask questions on our discord 👇
Disclaimer: “None of Oak’s articles is financial advice” The article is strictly for educational purposes only. Oak has no relationship to these projects. The information provided here is no advice, investment, or trading recommendation. We do not take responsibility for any of your decisions. Please make sure to seek professional advice before taking financial risks.
